

Figure here is a graphical representation of comparison between expenditure/earning on electricity consumption with or without Solar Installation.
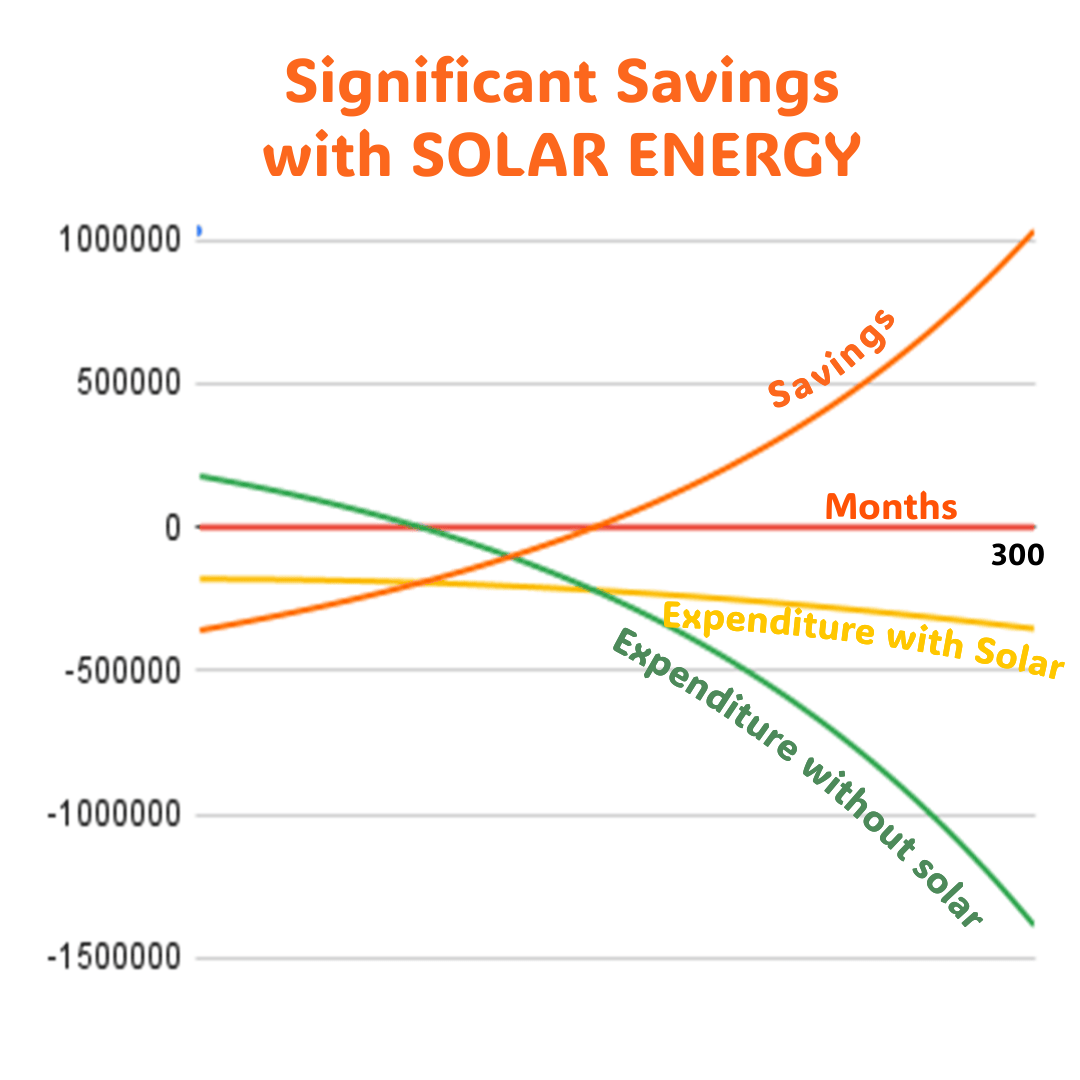
We have compared a case of one consumer spending money on installation of solar rooftop power plant on his roof and generated solar energy offsets some of his electricity bill and the rest of the bill he pay from his pocket and another consumer who invests equal amount of money at interest rate of 8% per annum and pays his bills out of this corpus monthly instead of spending money on installation of solar energy. Example shown above is for installation of 3kW Solar Rooftop Plant without considering subsidies. Comparison is drawn of financial journey for a period of 300 months (or 25 years -accepted lifespan of solar panels) duly accounting for drop in efficiency of generation with time.
Explaining the Financial Journey
Case-A (without switching to solar energy)
Cost of installation in above example for a 3kW solar power rooftop plant is take as 1.80 L. Hence consumer A starts his journey with positive corpus of 1.8L in his hand and invests this money for an annual return of 8% and continues to pay his monthly bill of 350 units per month from his pocket. His journey is represented by Green Line in the graph where his corpus continues to fall for 25 years. His total spent on this journey is about 14L in addition to his initial corpus of the 1.8L.
Case-B (After switching to solar energy)
Consumer-B utilizes that same initial corpus of 1.8L for installation of Solar Power System on his roof. Assuming that person is living in Gwalior, Madhya Pradesh average energy generation is 4 units of power per day per 1kW of solar capacity installation. Hence his daily power generation is 12 units resulting in monthly power generation of 360 units. This is about the same capacity as his average monthly electricity bill. Consumer-B has to pay electricity charges after some years due to drop in efficiency of solar panels which has been taken into account. He has to pay overall about 4L including his initial cost of solar installation His financial journey is represented by Yellow Line in the graph.
Conclusion
As it is apparent from the comparison above, consumer-B had to spend a lol less to meet his electricity requirement throughout the period of 25 years. His Savings are represented by Orange Line on the graph leading to a total savings of more than 10L during this period. He managed to save a huge amount of money in terms of energy consumption in addition to doing something for the environment. He manages to offset 4kg of CO2 emission on every 1 unit of electricity generated by solar panels. Become a wiser consumer with installation of solar installation on your rooftop and save huge amounts of money.
NOTE – Above analysis is representative actual numbers may vary depending upon several factors
I was looking through some of your blog posts on this
website and I conceive this site is very instructive!
Retain posting.Blog money
Hello! Do you know if they make any plugins to assist with Search Engine Optimization? I’m trying to
get my blog to rank for some targeted keywords but I’m not seeing very good results.
If you know of any please share. Thank you! You can read similar article here: Wool product
You really make it seem so easy with your presentation but I find this topic to be actually something that I think I would never understand. It seems too complicated and extremely broad for me. I am looking forward for your next post, I will try to get the hang of it!